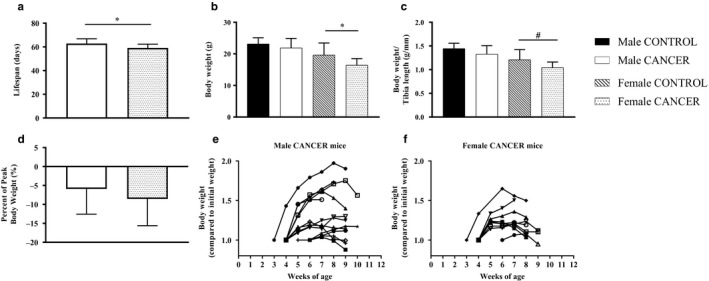
Figure 2.

Lifespan and body weight analysis. (a) Lifespan comparison between male and female CANCER mice. (b) Body weight and (c) body weight to tibia length ratio compared between sex and genotype. (d) Final body weight compared with peak body weight in male CANCER and female CANCER mice. Body weight compared to initial body weight throughout the lifespan of each (e) male and (f) female CANCER mouse. Sample sizes for male CONTROL, male CANCER, female CONTROL, and female CANCER mice body weight measurements were 9, 13–15, 9, and 9–11, respectively. * represents p ≤ .05 and # represents p = .08
