
FIGURE 4.
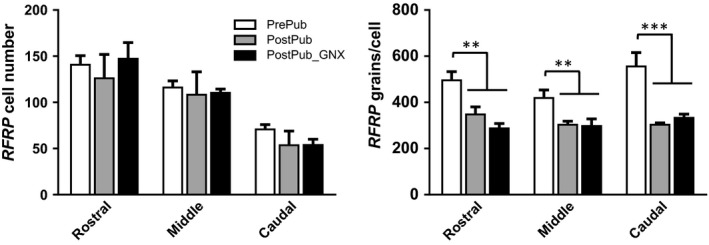
Mean (±SEM) RFRP gene expression in the DMH of ewes prior to and postpuberty and following GDX. Panels on the left show cell number and those on the right show expression/cell (silver grains/cell) in rostral mid and caudal sections of the dorsomedial nucleus. **p < .01, ***p < .001