
FIGURE 7.
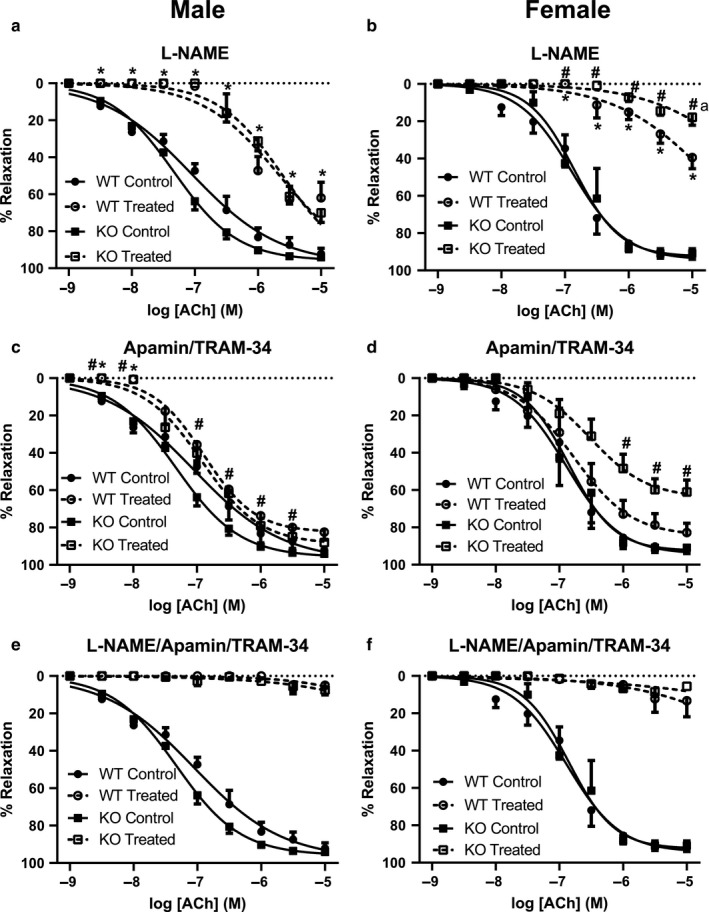
Contribution of NO and KCa channels to the relaxant effect of acetylcholine in isolated mesenteric artery rings. Acetylcholine dose–response curves were generated, as described for Figure 6, in the absence (Control) and presence (Treated) of L‐NAME (to inhibit NO production) (a, b), TRAM‐34 + apamin (to inhibit KCa channels) (c, d), or L‐NAME + TRAM‐34 + apamin (to inhibit both NO and KCa) (e, f). Each point represents the mean ± SEM obtained using five male WT, nine male ENT4‐KO, six female WT, and nine female ENT4‐KO arteries. Differences were assessed for significance by 2‐way ANOVA followed by the Bonferroni posttest for multiple comparisons with p < .05 considered significant. *Significantly different from Control. #Significant difference between WT and ENT4‐KO response to treatment