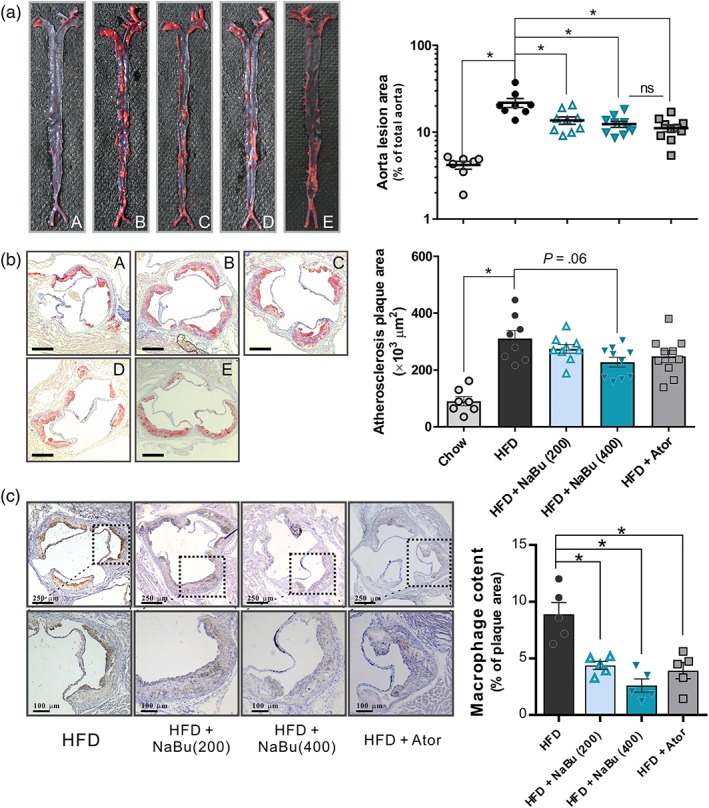
Figure 3.

Effect of butyrate on development of atherosclerotic lesion in ApoE−/− mice. Representative photographs (left) and quantifications (right) of en face atherosclerotic lesions in the entire aorta, the data were log transformed to generate a Gaussian‐distributed data set (a) and those of aortic root cross sections (b) stained with Oil Red O to determine foam cell formation for the chow group (A), HFD group (B), HFD + 200 mg·kg−1 NaBu (C), HFD + 400 mg·kg−1 NaBu (D), and HFD + atorvastatin group (E) after 16 weeks of treatment. Scale bar, 250 μm. n = 7–8 for chow and HFD groups, n = 9–10 for HFD + NaBu and atorvastatin groups. (c) Representative photographs immunohistochemical staining MAC‐3 in aortic root sections and quantifications. (n = 5). * represent significance versus HFD
