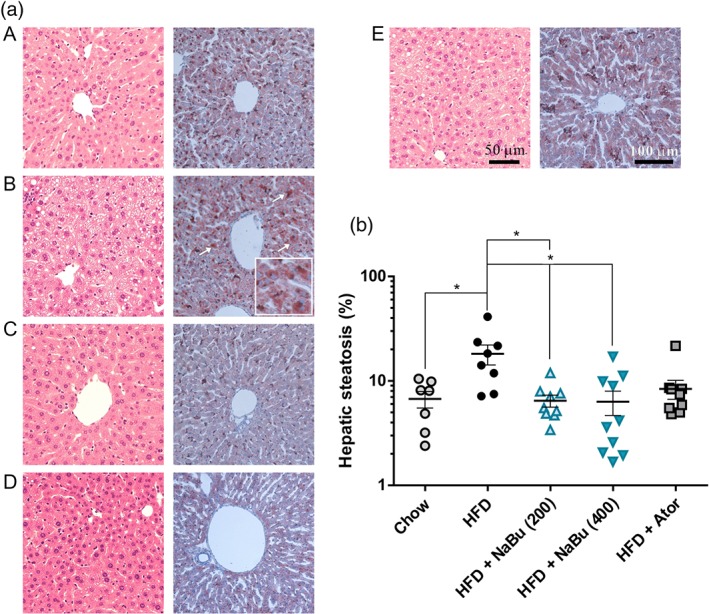
Figure 4.

Effect of butyrate on HFD‐induced hepatic steatosis in ApoE−/− mice. Representative photomicrographs of the liver sections from chow group (A), HFD group (B), HFD + 200 mg·kg−1 NaBu (C), HFD + 400 mg·kg−1 NaBu (D), and HFD + atorvastatin group (E) stained with haematoxylin and eosin (H&E) (right) and Oil Red O (left, staining area indicated by the arrow) (a) and quantitative analysis of lipid accumulation in mice liver (b). n = 7–8 for chow and HFD groups, n = 9–10 for HFD + NaBu and atorvastatin groups. * represent significance versus HFD. The data were log transformed to fit a Gaussian distribution
