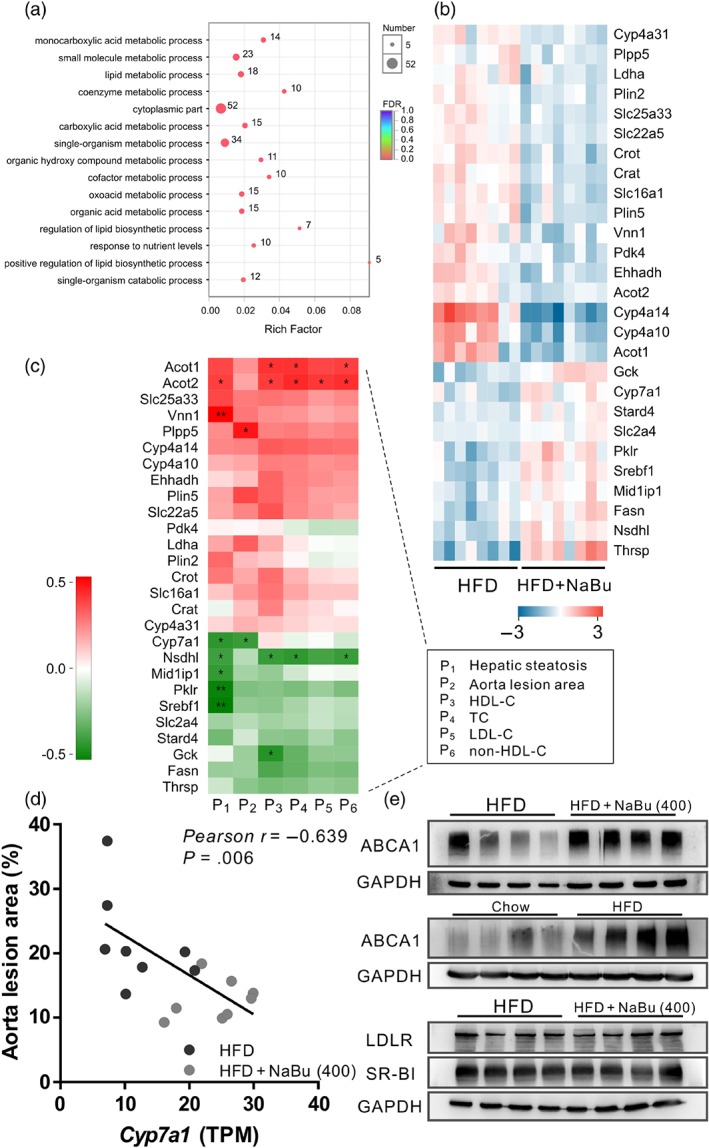
Figure 5.

Effect of butyrate on liver glucose and lipid metabolism in vivo. Liver transcriptome was compared between HFD and HFD + 400 mg·kg−1 NaBu groups. (a) Gene ontology term enrichments with Bonferroni correction for differentially expressed genes. (b) Heatmap of differentially expressed gene levels (log2) involved in glucose and lipid metabolism as assessed by RNA‐sequencing analysis. (c) Pearson correlation analysis between differentially expressed genes and phenotypes of atherosclerosis in mice treated with HFD or HFD + 400 mg·kg−1 NaBu. (d) Pearson correlation between aorta lesion area and Cyp7a1 levels in liver of mice treated with HFD or HFD + 400 mg·kg−1 NaBu. (e) Representative Western blot analysis of the indicated hepatic protein levels that involved in RCT. (n = 7 for chow group, n = 8 for other groups)
