Figure 1.

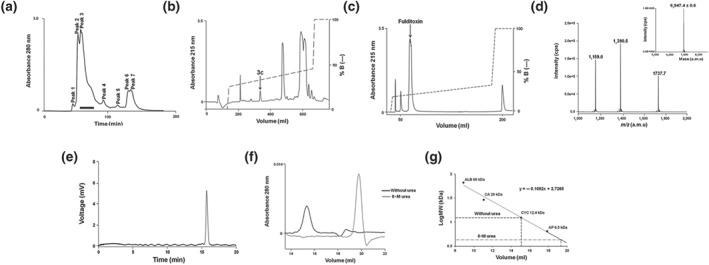
Isolation and purification of fulditoxin from crude Micrurus fulvius fulvius venom. Multi‐step HPLC purification of M. fulvius venom, determination of fulditoxin's MW by MS, and determination of its purity by capillary electrophoresis. (a) Size‐exclusion chromatography of crude MFV (50 mg·ml−1) on a Superdex 30 HiLoad (16/60) column. The column was pre‐equilibrated with Tris–HCl buffer (50 mM), pH 7.4. Proteins were eluted at a flow rate of 1.0 ml·min−1 using the same buffer. Protein elution was monitored at 280 nm. The fractions indicated by a horizontal black bar corresponding to peak 3 were pooled and subjected to RP‐HPLC. (b) RP‐HPLC profile of size‐exclusion chromatography peak 3 on a Jupiter C18 preparative column (5 μm, 300 Å, 21.2 × 250 mm) using a linear gradient (25–50% over 108 min; dotted line) of buffer B (80% ACN in 0.1% TFA) at a flow rate of 5 ml·min−1. Protein elution was monitored at 215 nm. The peak indicated by an arrow corresponding to peak 3c was rechromatographed on a shallower gradient. (c) Rechromatogram of peak 3c obtained by RP‐HPLC on a semi‐preparative column (5 μm, 300 Å, 10 × 250 mm) using a shallow gradient (25–45% over 80 min; dotted line) of buffer B (80% ACN in 0.1% TFA) at a flow rate of 2 ml·min−1. Protein elution was monitored at 215 nm. The resulting protein peak indicated by the arrow was named fulditoxin. (d) ESI‐MS profile of fulditoxin. The spectrum shows a series of multiply charged ions with mass/charge (m/z) ratios ranging from +4 to +6 charges. Inset, reconstructed mass spectrum of fulditoxin corresponding to a single homogeneous protein with MW of 6947.4 Da; CPS = counts s−1; a.m.u = atomic mass units. (e) Capillary electrophoresis of fulditoxin shows a single peak supporting homogeneity. (f) Analytical size‐exclusion chromatography profile of fulditoxin; 1.5‐μM fulditoxin was loaded onto a Superdex 75 column (1 × 30 cm) equilibrated with 50‐mM Tris–HCl buffer, pH 7.4 at a flow rate of 0.6 ml·min−1 in the presence and absence of 8‐M urea respectively. (G) MW determination on size‐exclusion column. Column calibration was done using BSA (ALB; 66 kDa), carbonic anhydrase (CA; 29 kDa), cytochrome c (CYC; 12.9 kDa), aprotinin (AP; 6.5 kDa), and blue dextran (200 kDa) as molecular mass markers
