
Figure 3.
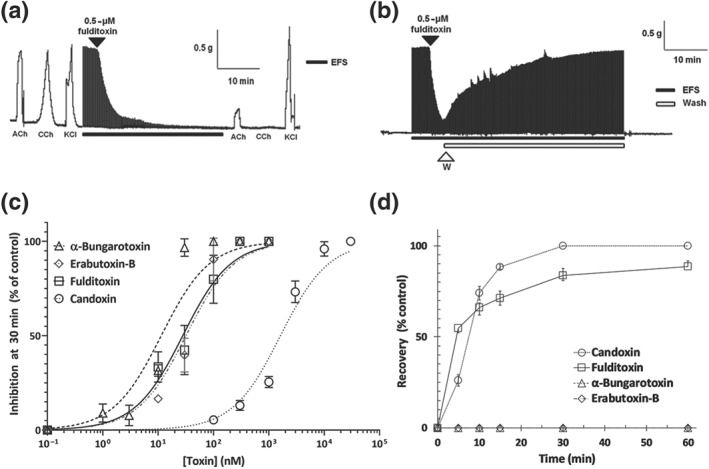
Reversible postsynaptic neuromuscular blockade produced by fulditoxin in the avian neuromuscular junction. Pharmacological characterization of native fulditoxin (nFulditoxin) on isolated nerve‐muscle models in organ bath experiments. (a) Segment of tracing showing the blockade of nerve‐evoked twitches of the chick biventer cervicis muscle (CBCM) produced by fulditoxin (0.5 μM). Contractions produced by exogenous ACh (200 μM), carbachol (CCh; 20 μM), and KCl (30 mM) before and after incubation with nFulditoxin are also shown. (b) Segment of tracing showing the reversible blockade of nerve‐evoked twitches of the CBCM produced by nFulditoxin (0.5 μM). Upon 80% inhibition of the nerve‐evoked twitch responses, the muscle was washed with fresh Krebs solution (washes lasting 30 s, at intervals of 1 min, for a period of 30 min) to remove the toxin from the bath chamber. In panels (a) and (b), the black horizontal bar indicates EFS (0.2 Hz, 0.1 ms and 7–10 V) and the unfilled bar indicates the duration of the wash. (c) Concentration–response curves for the neuromuscular blockade produced by nFulditoxin, α‐bungarotoxin and erabutoxin‐b and candoxin. Neuromuscular blockade was calculated as the twitch height of the muscle after 30‐min exposure to the respective toxin, expressed as a percentage of the control twitch responses of the muscle to supramaximal nerve stimulation. The IC50 values of nFulditoxin, α‐bungarotoxin, erabutoxin‐b, and candoxin on the CBCM are 27.8 nM (95% CI [17.7, 43.1]), 11.4 nM (95% CI [7.9, 16.2]), and 31.75 nM (95% CI [21.8, 45.8]) respectively. Each data point represents the mean ± SEM of three independent experiments. (d) Comparison of reversibility of neuromuscular blockade showing the time course of reversal of the neuromuscular blockade produced by nFulditoxin, α‐bungarotoxin, erabutoxin‐b, and candoxin. The recovery is calculated as a percentage of the control twitch responses. Each data point represents the mean ± SEM of three independent experiments