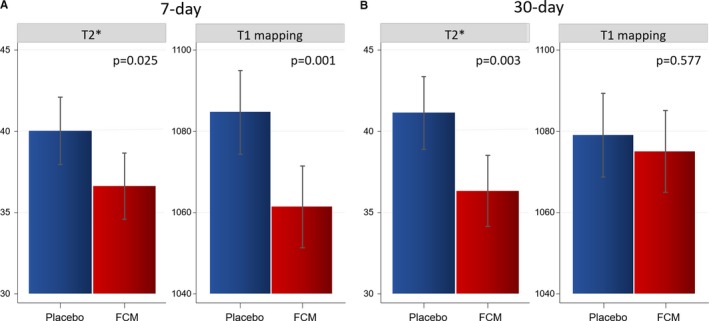
Figure 2.

T2* and T1 mapping after administration of FCM. A, Seven‐day comparison of LSM (95% CIs) between FCM and placebo. B, Thirty‐day comparison of LSM (95% CIs) between FCM and placebo. FCM indicates ferric carboxymaltose; LSM, least‐square means from a linear mixed regression analysis.
