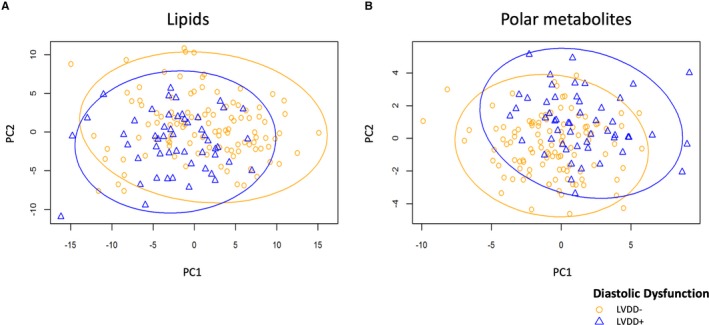
Figure 1.

Scores plot of metabolites and lipids according to presence of LVDD. Scores plot showing metabolites from principal component 1 and 2 obtained with PLS‐DA analysis of participants with LVDD (blue triangles and line) vs without LVDD (orange circles and line) for (A) lipids and (B) polar metabolites. LVDD indicates left ventricular diastolic dysfunction; PC, principal component; PLS‐DA, partial least squares discriminant analysis.
