
Figure A.
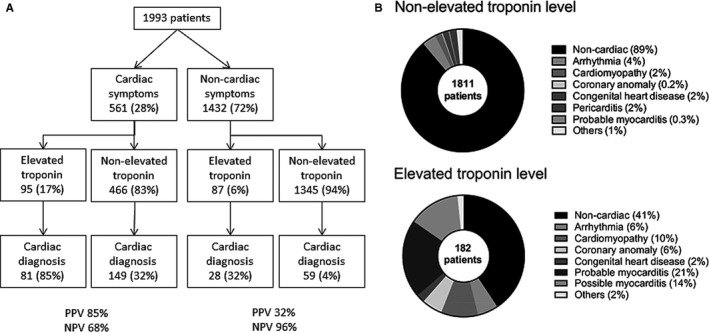
Flowchart of cardiac diagnosis based on cardiac vs noncardiac presentation and troponin level. The positive predictive value (PPV) and negative predictive value (NPV) are listed for patients with cardiac symptoms and for patients with noncardiac symptoms. B, Diagnosis at discharge in patients with and without elevated troponin.