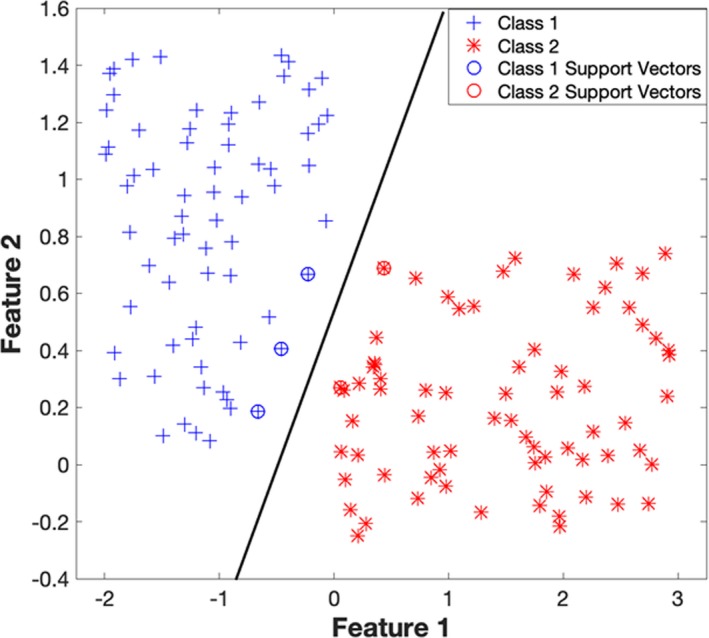
Figure 3.

This figure illustrates the SVM binary classification algorithm, which has been trained over a sample data. Let class 1 refer to the samples belonging to the first class (on the left‐hand side) and class 2 refer to the samples belonging to the other class. The data points (both class 1 and class 2) which are encircled/starred, are the support vectors. The support vectors are those data points that the algorithm identifies to be hardest in getting correctly classified. The SVM algorithm picks an optimal hyperplane that maximizes the margins between itself and the support vectors. SVM indicates support vector machine.
