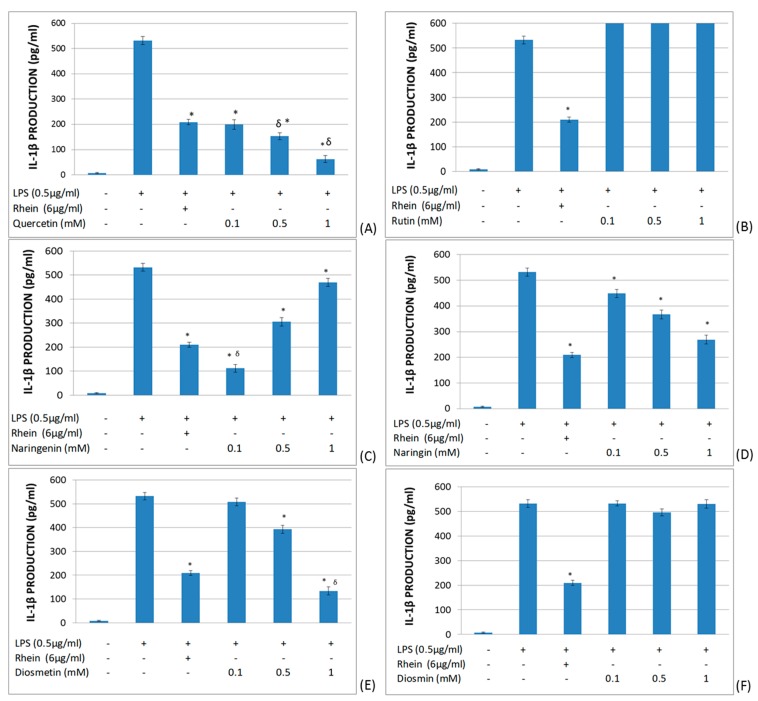
Figure 2.
Effects of different flavonoids on the production of IL-1β in LPS-stimulated (0.5 μg/mL) whole blood after 6 h of culture. The different panels show the results of the effects of quercetin (A), rutin (B), naringenin (C), naringin (D), diosmetin (E), and diosmin (F). All data are expressed as the mean (top segment of the rectangles) ± SEM (vertical segment) of thirty independent experiments. * p < 0.05: significantly different when compared to the LPS control. δp < 0.05: significantly different when compared to the rhein control.

