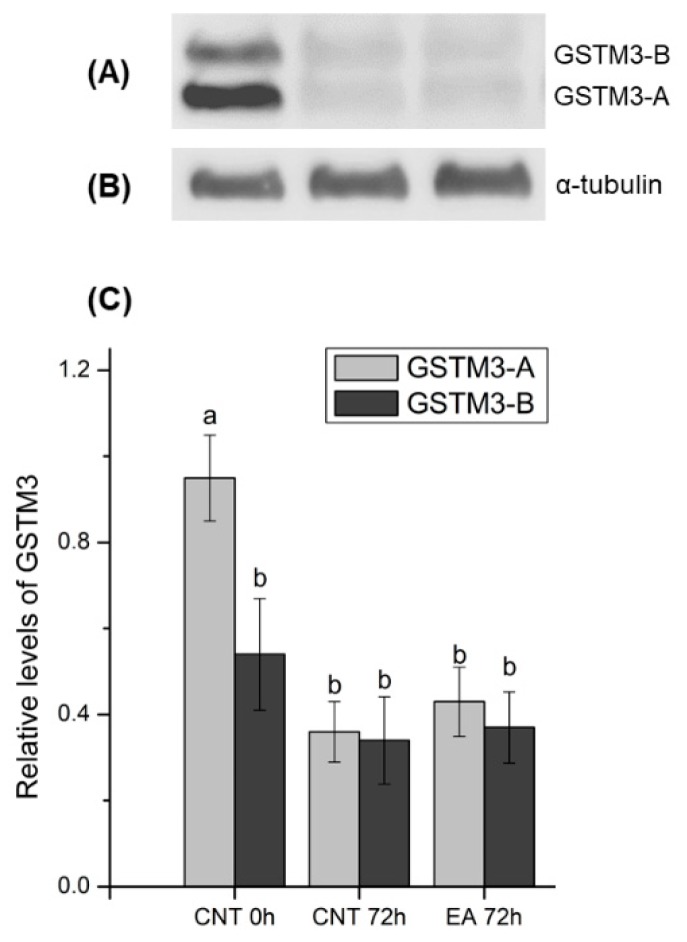
Figure 7.
(A) Representative Western blot resulting from incubation with the GSTM3 antibody and (B) its loading control (α-tubulin). (C) Relative abundances of ~25 (GSTM3-A) and ~28 (GSTM3-B) kDa bands as mean ± standard error of the mean in all treatments. Values were normalised using the α-tubulin protein as an internal standard. Each sperm sample (n = 10) was evaluated two times. CNT 0 h: control at 0 h of sperm liquid storage; CNT 72 h: control at 72 h of sperm liquid storage; EA 72 h: Ethacrynic acid (EA)-treated samples at 72 h of liquid storage. Different letters (a, b) indicate significant differences (p < 0.05) between treatments.

