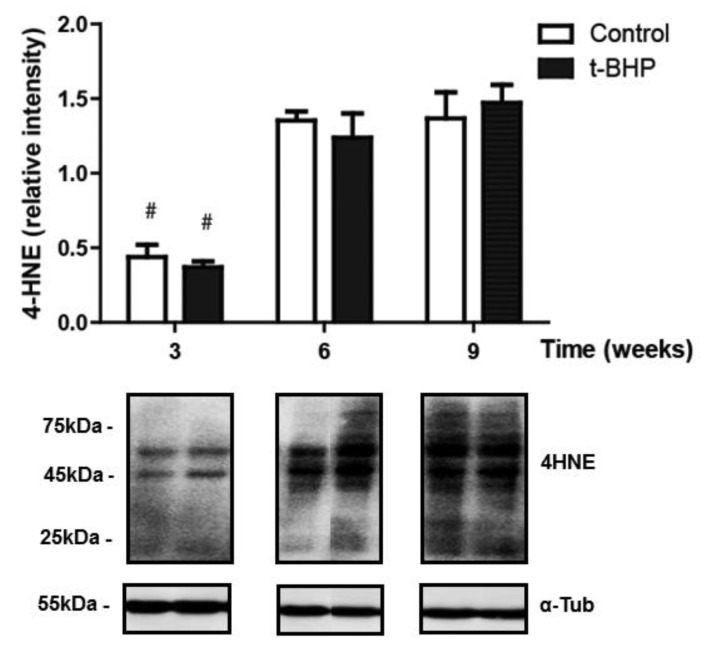
Figure 8.
Lipid peroxidation in the testis of control and t-BPH-treated male rats. The results of relative intensities (upper panels) are expressed as mean ± SEM. The blots presented are representative of experiments with 4 different rats. Lanes showing protein bands have been pasted but belong to the same blot and have the same film exposure. # Means lower than all other groups, (p ≤ 0.05; Two-way ANOVA and Bonferroni post-test, n = 4).

