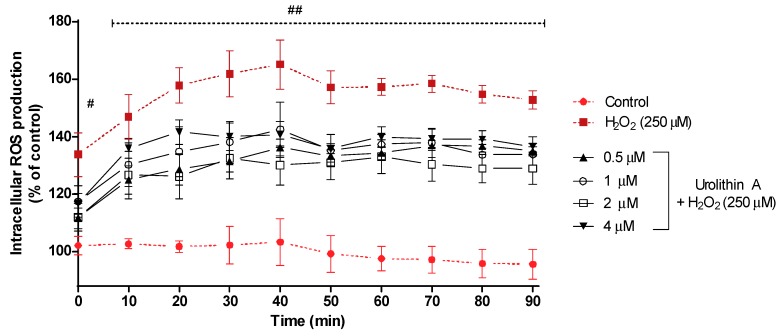
Figure 3.
ROS production in Neuro-2a cells subjected to oxidative stress by hydrogen peroxide (250 μM) and treatments with urolithin A (0.5–4 μM). Data are expressed as percentage over control cells and the assay was carried out for 90 min in order to measure intracellular ROS production. Note: # p < 0.005 versus control; ## p < 0.001 versus control. Significant differences appeared at the starting point for H2O2-N2a cells over control cells (p < 0.001). However, pre-treatments with 0.5 and 2 μM urolithin A at 0 and 10 min were associated with significant differences (p < 0.01). After 20 min, significant differences were reached at 1 μM (p < 0.01). Finally, 4 μM of the antioxidant exhibited significant differences (p < 0.01) between 40 and 60 min. Urolithin A (2 μM) displayed a greater mitochondrial response than any other co-treatment.

