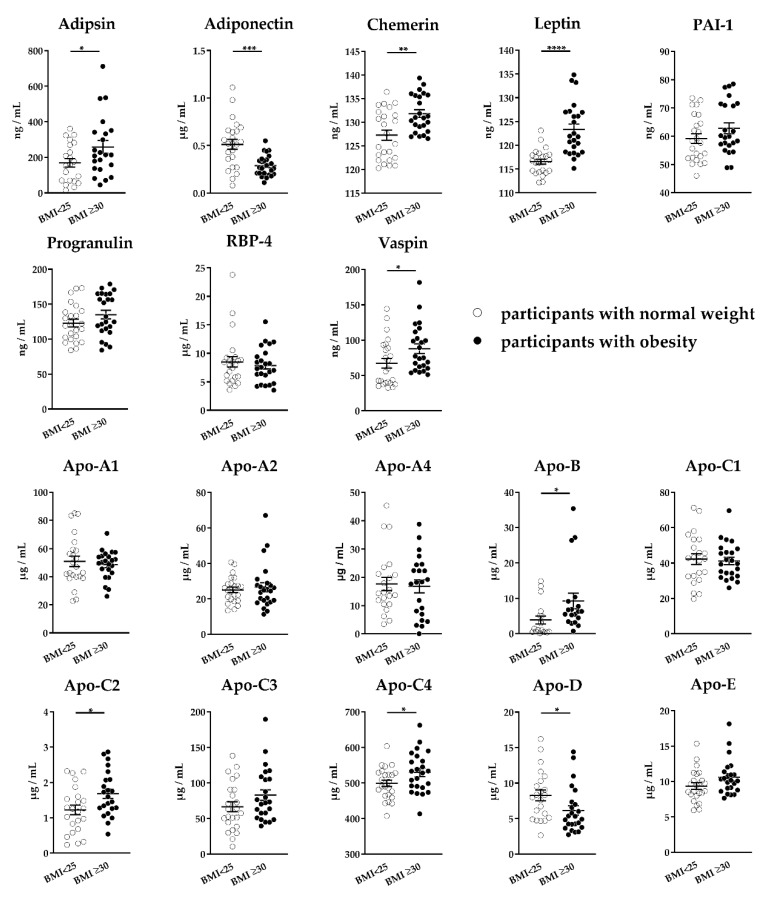
Figure 3.
Adipokine and apolipoprotein levels in serum. Serum samples of normal weight controls (n = 25, body mass index (BMI) < 25) and obese patients (n = 25, BMI ≥ 30) were depleted, digested, and analyzed using our multiple reaction monitoring (MRM)-based assay. Scatter plots show mean ± SEM (standard error of the mean). Statistical significances were evaluated by Student’s t-test. * indicates statistically significant differences vs. normal weight controls: * p-value < 0.05, ** p-value < 0.01, *** p-value < 0.001, **** p-value < 0.0001.

