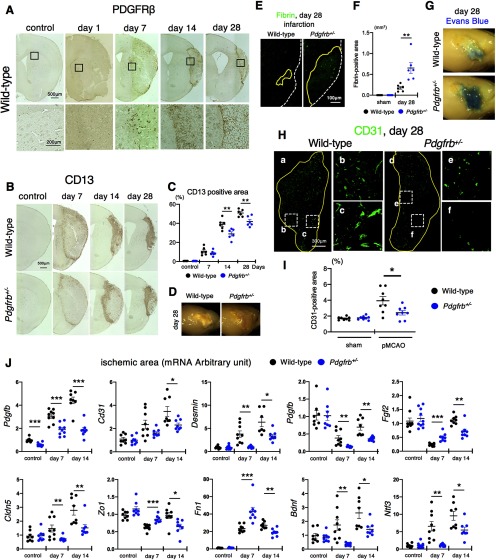
Figure 3.
PDGFRβ is important for intrainfarct angiogenesis and fibrosis. A, Immunohistochemistry of PDGFRβ at baseline and on days 1, 7, 14, and 28 after pMCAO (scale bar, 500 μm). Magnified images in the squares are shown at the bottom. B, Immunohistochemistry of CD13, a marker of pericyte and pericyte-derived cells, in control and on days 7, 14, and 28 after pMCAO (scale bar, 500 μm). C, Quantification of CD13-positive areas in control and on days 7, 14, and 28 after pMCAO in wild-type and Pdgfrb+/– mice (n = 6, each group). D, Representative macroscopic observation of the brain surface on day 28 after pMCAO (n = 10). E, Fibrin staining on day 28 after pMCAO (scale bar, 100 μm). F, Quantification of fibrin-positive areas in mice on day 28 after pMCAO and in sham-operated mice (n = 6, each group). G, Representative macroscopic images of Evans blue dye leakage in the brain on day 28 after pMCAO (n = 6). H, Immunofluorescence labeling of CD31 on day 28 after pMCAO in wild-type (a) and Pdgfrb+/– mice (d; scale bar, 300 μm). Magnified images in the dotted squares (b, c, e, f) are shown to the right. I, Quantification of intrainfarct CD31 density in mice on day 28 after pMCAO and in sham-operated mice (n = 8, each group). J, Quantitative PCR of genes expressed in non-infarct control and within infarct areas on days 7 and 14 after pMCAO in wild-type (black) and Pdgfrb+/– mice (blue; n = 8, each group). Data are shown as the mean ± SEM. C, F, I, *p < 0.05, and **p < 0.01, unpaired t test. J, *p < 0.05, **p < 0.01, and ***p < 0.001, one-way ANOVA followed by Bonferroni’s post hoc test.

