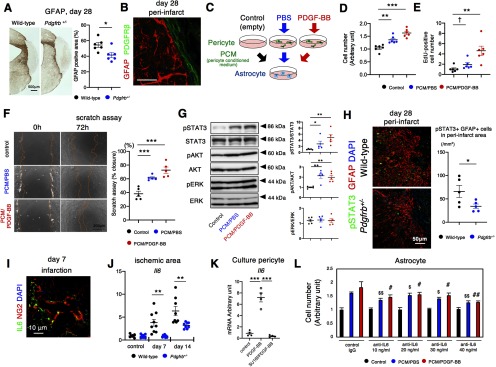
Figure 4.
Pericyte-astrocyte interaction in peri-infarct areas after pMCAO. A, Immunohistochemistry for GFAP (scale bar, 500 μm) and quantification of GFAP-positive areas on day 28 after pMCAO in wild-type and Pdgfrb+/– mice (n = 6, each group). B, Double immunofluorescence labeling of GFAP (red) and PDGFRβ (green; scale bar, 20 μm) on day 28 after pMCAO. PDGFRβ-positive fibrotic lesion and GFAP-positive astrogliosis form a clear boundary. C, Experimental scheme for phenotypic changes induced in astrocytes by pericyte culture medium (black, control), PCM treated with PBS (blue, PCM/PBS) or PDGF-BB (10 ng/ml; red, PCM/PDGF-BB). D, MTT assay for astrocytes after treatment with PCM for 24 h (n = 6, each group). E, Astrocyte proliferation assay as assessed by immunofluorescence of EdU after treatment with PCM for 24 h (n = 6, each group). F, Astrocyte scratch assay after treatment with PCM for 72 h (scale bar, 200 μm; left). Quantification of wound recovery (n = 5, each group). G, Immunoblot analyses of STAT3 and phospho-STAT3, AKT and phospho-AKT, and ERK and phospho-ERK in astrocytes after treatment with CM for 30 min (n = 5, each group). H, Representative immunofluorescence labeling for pSTAT3 (green) and GFAP (red), and DAPI (blue) in the peri-infarct area after pMCAO in wild-type and Pdgfrb+/– mice on day 28 (scale bar, 50 μm). Quantification of the number of pSTAT3 and GFAP double-positive cells are evaluated (n = 5, each group). I, Double immunofluorescence labeling of NG2 (red) and IL6 (green; scale bar, 10 μm) on day 7 after pMCAO. J, Quantitative PCR of Il6 expression in non-infarct hemisphere and within infarct areas on days 7 and 14 after pMCAO in wild-type (black) and Pdgfrb+/– mice (blue; n = 8, each group). K, Expression change of Il6 in pericytes treated with PDGF-BB in the presence or absence of SU16f (n = 4, each group). L, MTT assay for astrocytes treated with PCM in the presence of anti-IL6 antibody (10–40 ng/ml; n = 6, each group). Data are shown as the mean ± SEM. A, H, J, *p < 0.05, and **p < 0.01, unpaired t test. D–G, K, L, †p < 0.1, *p < 0.05, **p < 0.01, and ***p < 0.001; $p < 0.05 and $$p < 0.01 versus control IgG with PCM/PBS; and #p < 0.05 and ##p < 0.01 versus control IgG with PCM/PDGF-BB, one-way ANOVA followed by Bonferroni’s post hoc test.

