Figure 6.
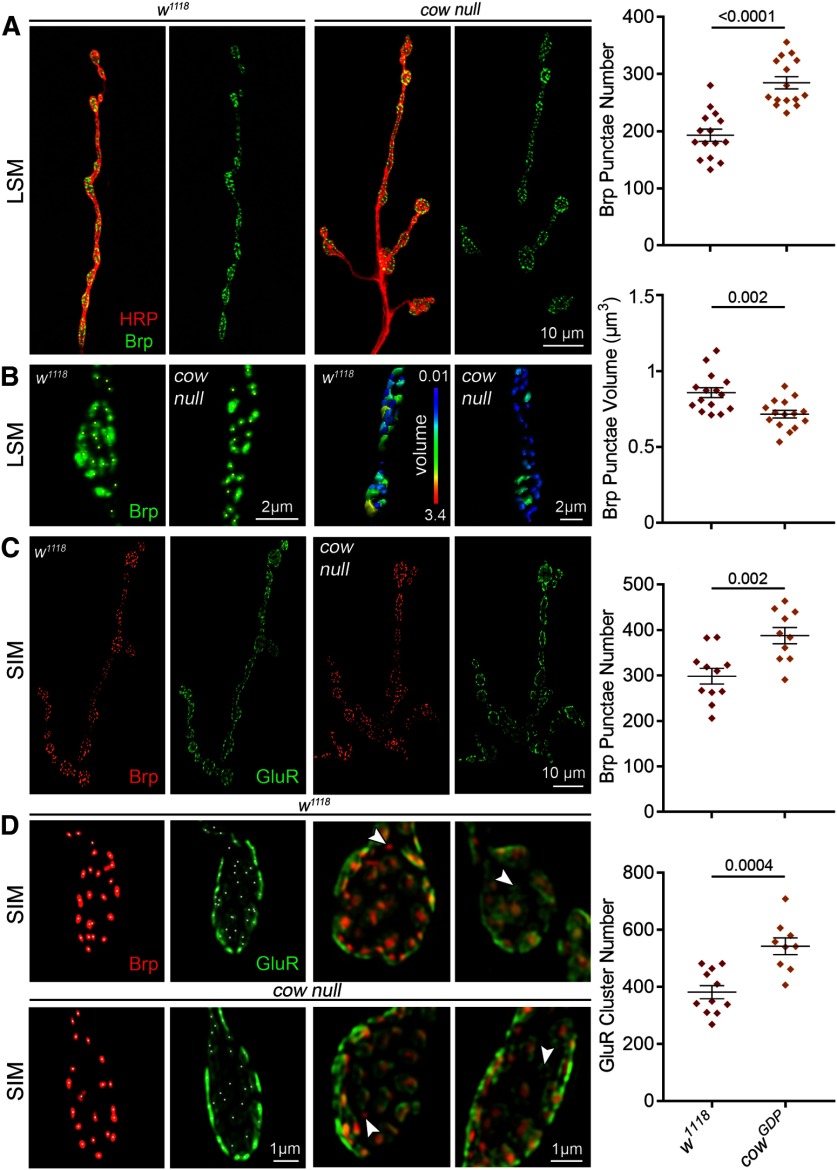
Cow limits presynaptic active zones and glutamatergic synapse number. A, Representative muscle 4 NMJ images from confocal LSM of genetic background controls (w1118, left) and cow null mutants (cowGDP, right) colabeled for presynaptic membrane marker (HRP, red) and the active zone scaffold Brp (green). Brp alone is shown in right panels and the quantified Brp punctae number is shown to the right. B, High-magnification synaptic bouton images with Brp punctate identified using Imaris software (asterisks, left) and volume indicated in a heatmap (scale, 0.01–3.4 μm3; right). Quantified Brp punctae volume shown to the right. C, Representative NMJ images from a SIM of controls (w1118) and cow nulls (cowGDP) colabeled for both presynaptic active zones (Brp, red) and postsynaptic glutamate receptors (GluRIIC, green). The quantified Brp punctae number is shown to the right. D, High-magnification SIM images of juxtaposed Brp punctae and GluR clusters at synapses. Arrowheads indicate Brp or GluR domains without a partner, which are observed at equal frequency in both genotypes. Quantified GluR cluster number is shown to the right. Data shown in scatter plots, with mean ± SEM. p Values are shown for each statistical comparison.

