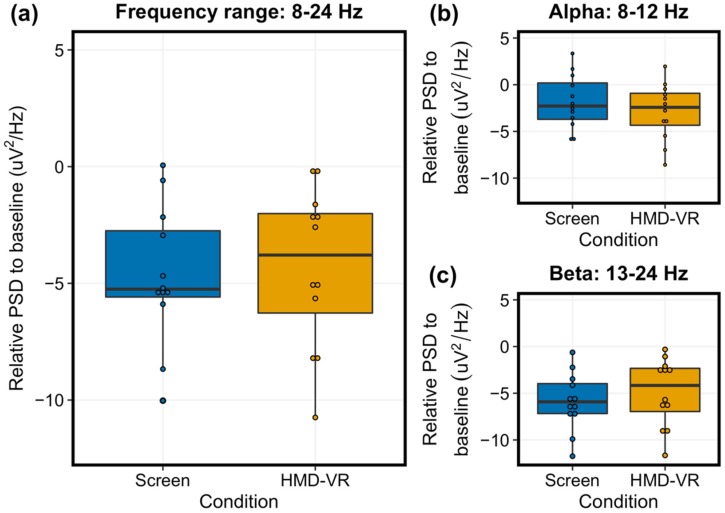
Figure 5.
Average power spectral density during trials between conditions. (a) The relative group-level PSD for the target electrode C3, representing the left motor cortex (8-24 Hz) between the Screen (left, blue) and HMD-VR (right, yellow) conditions was not significantly different. (b) The relative group-level alpha between the Screen (left, blue) and HMD-VR (right, yellow) conditions was also not significantly different. (c) The relative group-level beta between the Screen (left, blue) and HMD-VR (right, yellow) conditions was also not significantly different.

