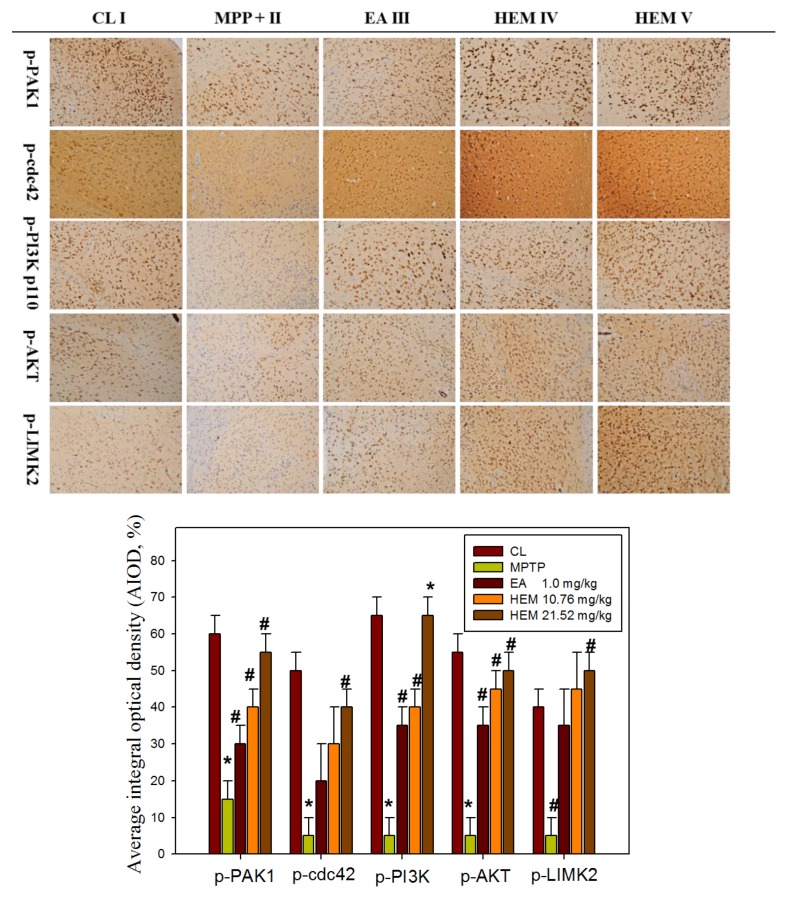
Figure 7.
Post-treatment with erinacine A reversed the PAK1/AKT/LIMK2/ pathways in the MPTP-treated animals. Representative IHC images of p-PAK1, p-cdc42, p-PI3K p110, p-AKT, and p-LIMK2 in the brain region of the animals with MPP+ or MPP+ and erinacine A are as indicated. Quantified data of the average integral optical density are expressed as the mean ± SEM (fold increase of untreated animals). Data are expressed as mean ± S.D. (n = 6/group); * p < 0.01, as compared to the control group; # p < 0.01, as compared to the MPP+-treated group.

