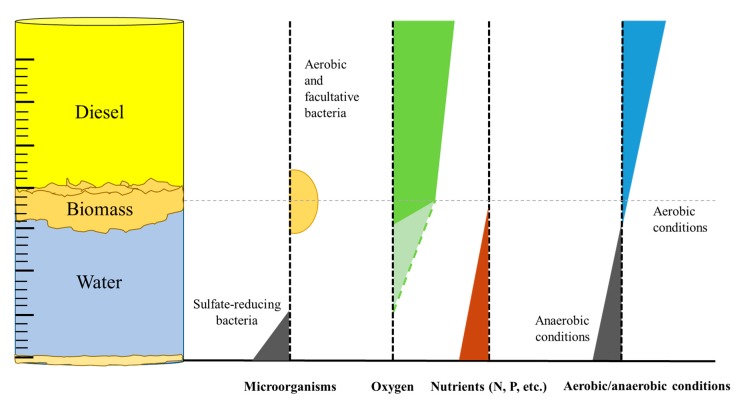
Figure 4.
Profiles which represent microbial growth and the concentration of oxygen and nutrients (nitrogen, phosphorous, etc.), as well as the changes of redox potential in an oil/water system. (The dashed line in the oxygen profile represents reduced depletion in cases of immature biofilms and/or limited microbial growth.)

