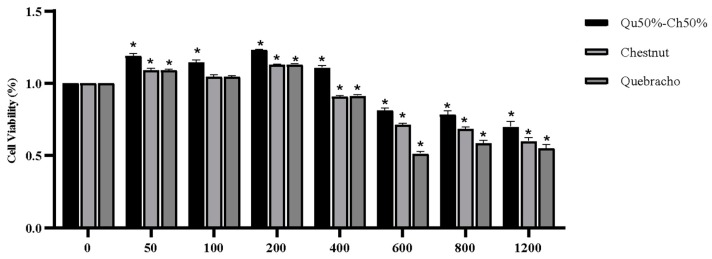
Figure 5.
Effect of different concentrations (0–1200 µg/mL) of in vitro digested Qu50%–Ch50% on IPEC-J2 cell metabolic activity (expressed as cell viability, MTT assay). Data are expressed as lsmeans ± SEM (n = 3, one-way ANOVA). * indicates significant differences at p < 0.05 compared to respective control wells (0 µg/mL).

