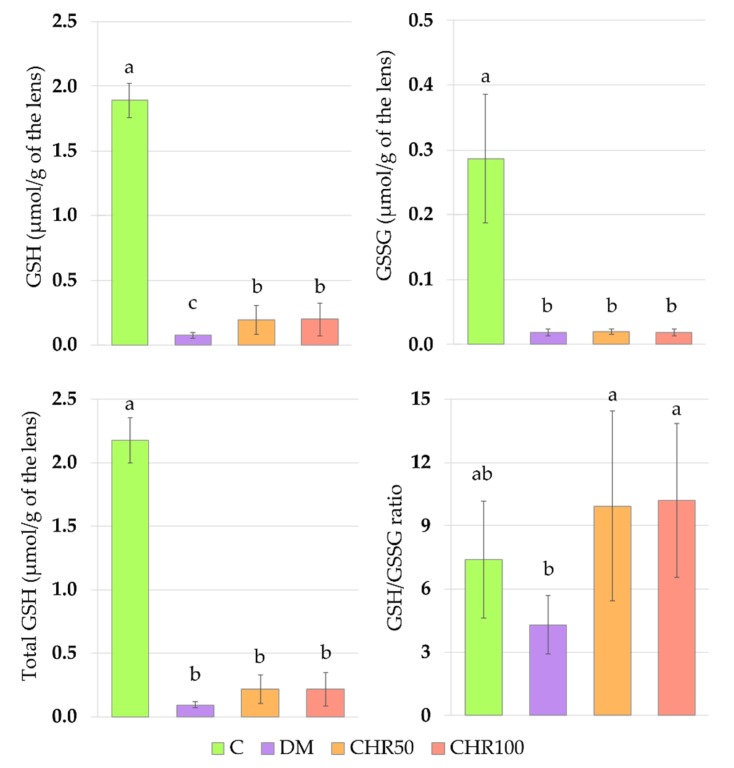
Figure 1.
Effect of chrysin on the reduced, oxidized and total glutathione levels and GSH/GSSG ratio in the lenses of the type 1 diabetic rats. Results are presented as arithmetical means ± SD. The letters (a–c) above the bars indicate statistical significance (one-way ANOVA followed by Fisher’s LSD test). The same letter(s) above the bars indicate no significant differences of values in measured parameters at p < 0.05. C—control, non-diabetic rats; DM—control, type 1 diabetic rats; CHR50—type 1 diabetic rats treated by gavage with chrysin at a dose of 50 mg/kg for 28 days; CHR100—type 1 diabetic rats treated by gavage with chrysin at a dose of 100 mg/kg for 28 days; GSH—reduced glutathione; GSSG—oxidized glutathione; Total GSH—total glutathione.

