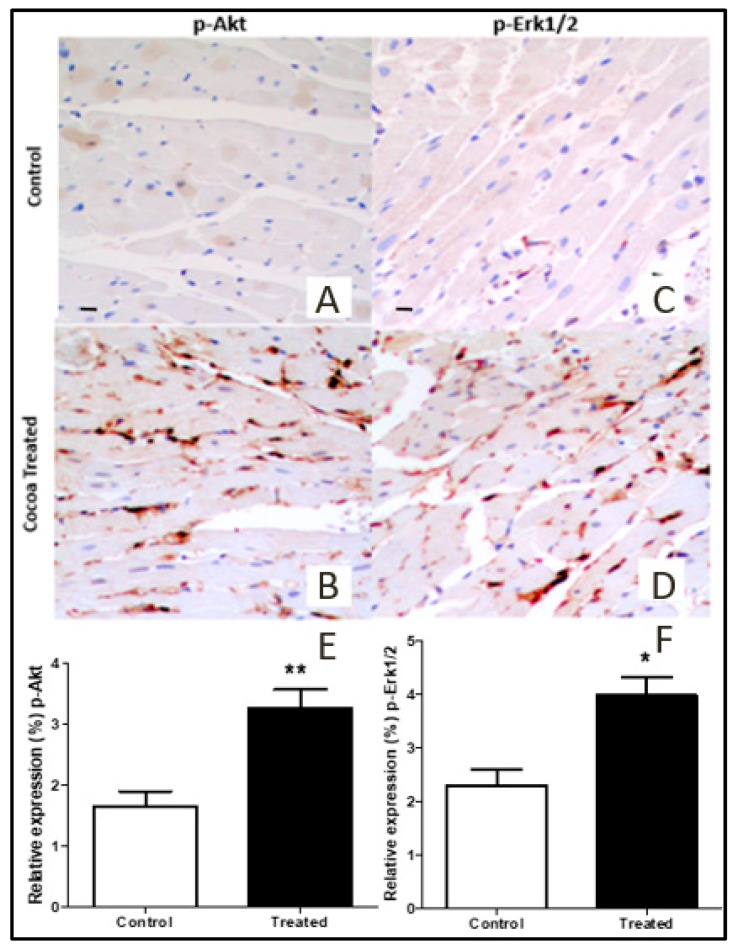
Figure 5.
Immunohistochemical labeling of p-Akt (A,B,E) and p-Erk1/2 (C,D,F) in cocoa-treated rat myocardial tissue compared to control. The graphs show a significant elevation in the activation of p-Akt and p-Erk1/2 in the myocardial tissue of cocoa-treated rats (n = 10) compared to control (n = 10). Representative images (20×). Data illustrated in the bar graph are presented as mean ± SD. p-value less than 0.05 considered statistically significant. P-ERK1/2, phosphorylated extracellular signal regulated kinases ½; p-Akt, phosphorylated serine-threonine protein kinase, (* p < 0.05, ** p < 0.001).

