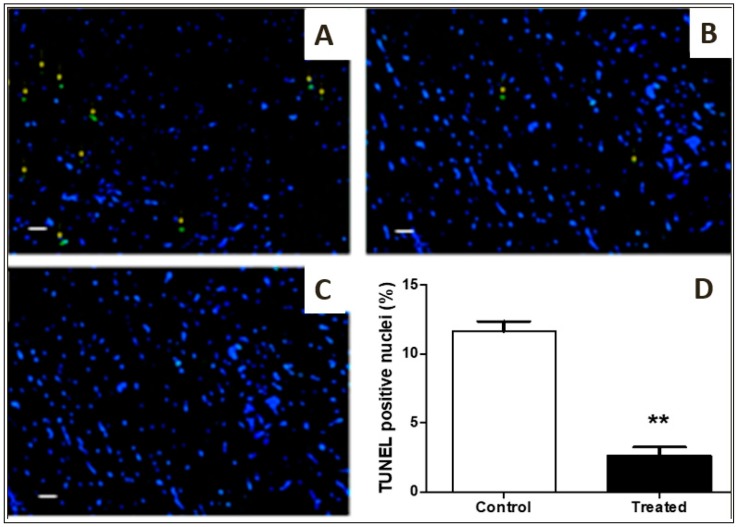
Figure 6.
TUNEL Assay: (A,B,C): Representative images (n = 10 for each group) immunofluorescent staining for TUNEL-positive nuclei in control, treated, and negative control groups (20× magnification). TUNEL-positive myocytes were less in number in the treated group (A) as compared to control group (B). Yellow arrows indicate apoptotic nuclei and (C) negative control. p-value = 0.002 considered significant (** p < 0.001, control versus treated), scale bar is 100 µm. (D): Graphical presentation of apoptotic nuclei in control vs treated groups.

