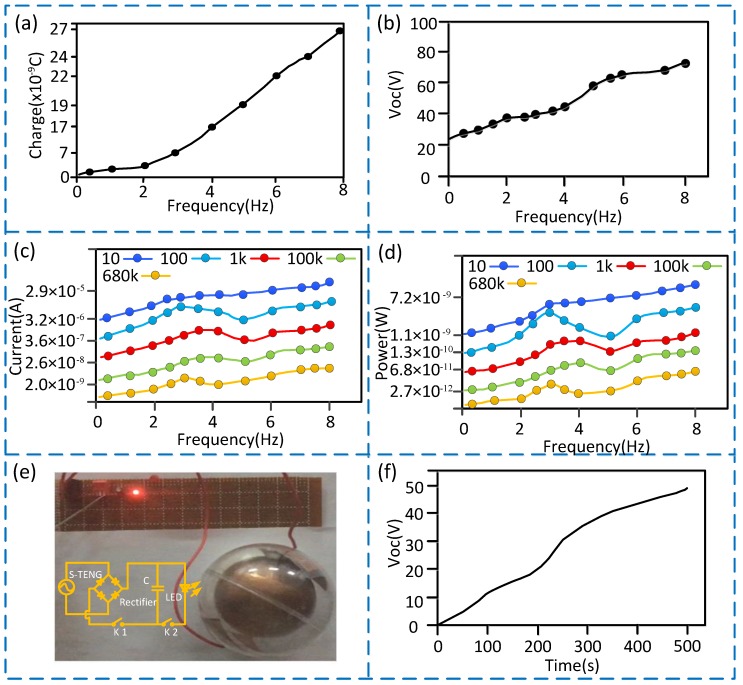
Figure 4.
Test results of the S-TENG power generation performance. (a) Curve showing the variation of the transferred charges over the vibration frequency; (b) Curve showing the variation of the output voltage over the vibration frequency; (c) Curve showing the variation of the output current over the vibration frequency with different resistances; (d) Curve showing the variation of the output power over the vibration frequency with different resistances; (e) A picture showing the LED (light-emitting diode) lighted by the S-TENG; (f) charging curve of the capacitor (50 V, 2 μF) with the load resistance (1 k) in 8 Hz.

