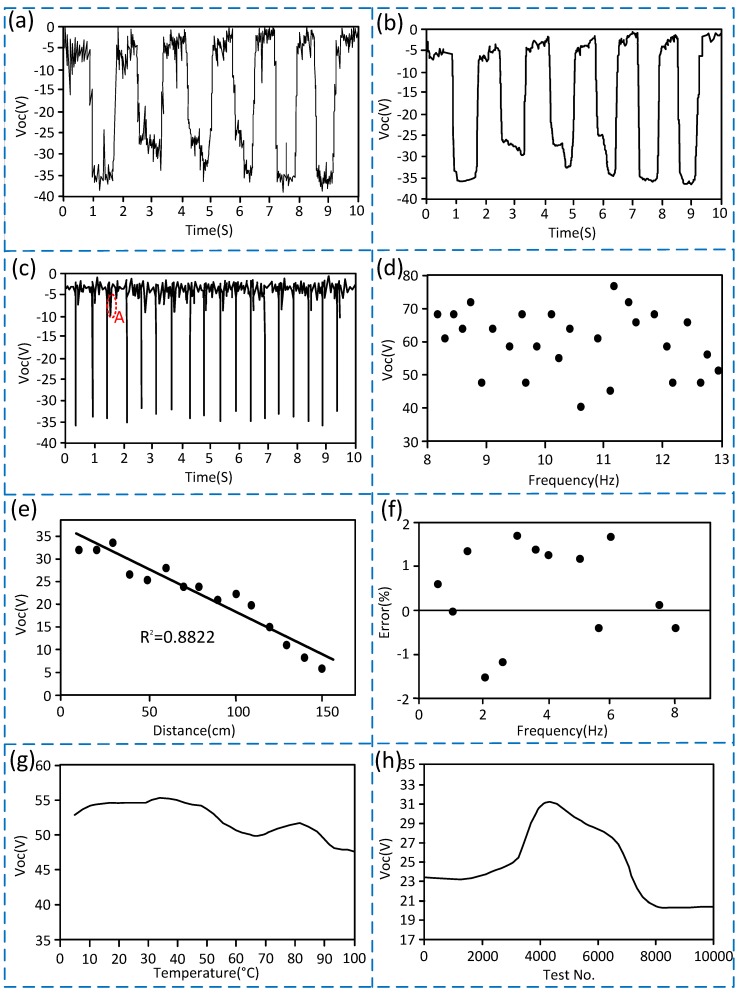
Figure 5.
Test results of the S-TENG sensing performance. (a) Curve showing the output voltage of the S-TENG when the vibration frequency is 0.6 Hz (Unfiltered signal); (b) Curve showing the output voltage of the S-TENG when the vibration frequency is 0.6 Hz (Filtered Signal); (c) Curve showing the output voltage of the S-TENG when the vibration frequency is 1.8 Hz; (d) Scatter plot of output voltage of the S-TENG when vibration frequency exceeds 8 Hz; (e) Curve showing the variation of the output voltage over the distance from the vibration source when the vibration frequency is 2 Hz; (f) Measurement error scatter plot; (g) Curve showing the variation of the output voltage over the temperature when the vibration frequency is 4.5 Hz; (h) Curve showing the variation of the output voltage over the test times when the vibration frequency is 1 Hz.

