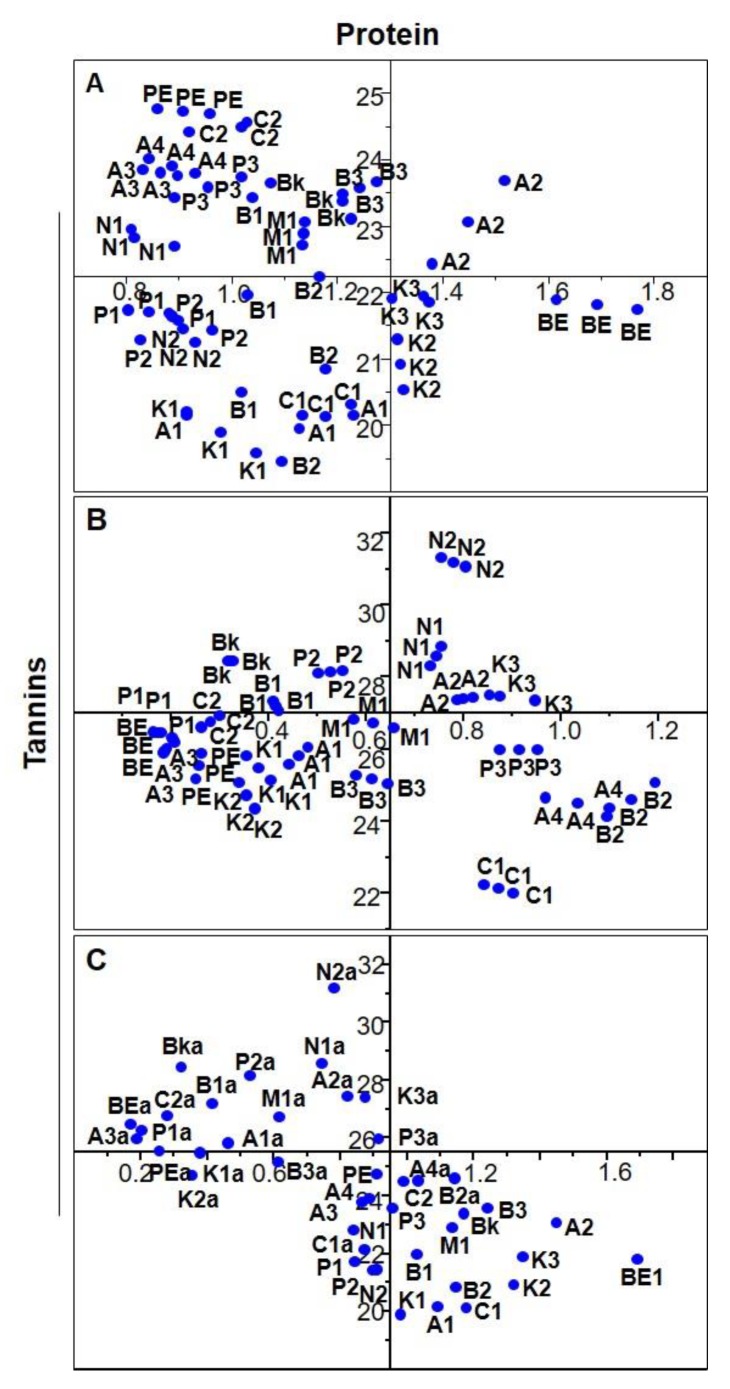
Figure 5.
Plot of tannins vs. protein content of 10 common bean cultivars, grouped according to their morphological characteristics. Cultivars: Arikara yellow (A1, A2, A3, A4), butter bean (B1, B2, B3), cranberry (C1, C2), red kidney (K1, K2, K3), navy (N1, N2), pinto (P1, P2, P3), black (Bk), brown eyed (BE), pink eyed (PE), and tarrestre (M). (A) Triplicates of each sample from 2013, (B) triplicates of each sample from 2014, (C) average of each sample in both years, the samples being divided according to their harvest years.

