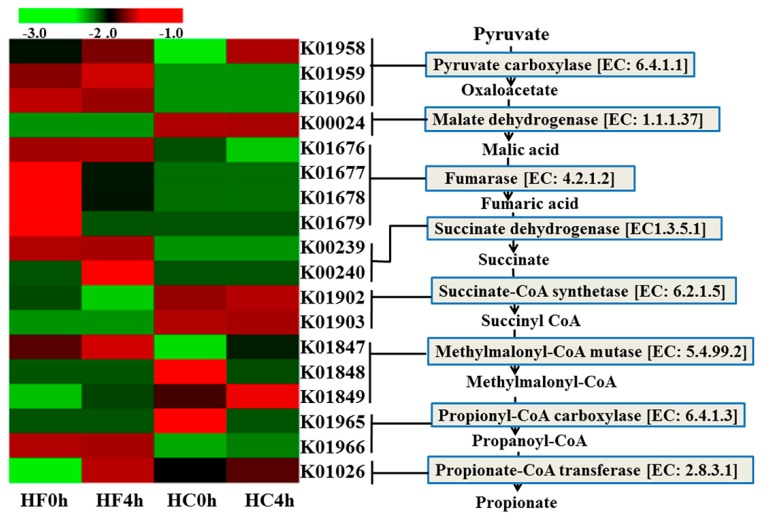
Figure 1.
The metagenomic abundance of key elements of the propionate production pathway. Left pane: heat map of KEGG orthologues for the EC numbers involved in propionate production (lines connect the heat map to the propionate production pathway indicating which K0 numbers represent the given enzymes). Right pane: the propionate production pathway showing enzyme classification (EC) numbers. Green and red color indicates low and high abundance, respectively. Computation based on Log10.

