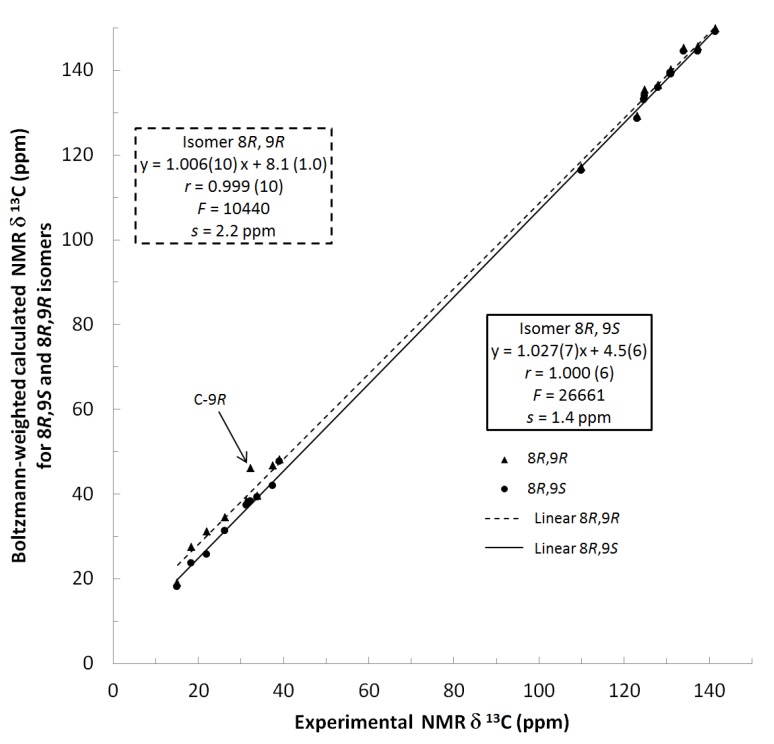
Figure 3.
Plot of Boltzmann-weighted calculated NMR δ13C of 8R, 9S and 8R, 9R isomers versus experimental NMR δ13C of dodovisate C (1). Statistics for the regression of calculated versus experimental chemical shifts for both isomers. The slope, the intercept, the correlation coefficient (r) are followed by their standard error on the last digit(s) in brackets. F is the Fisher F-statistic and s the standard error of the fit.

