Figure 2.
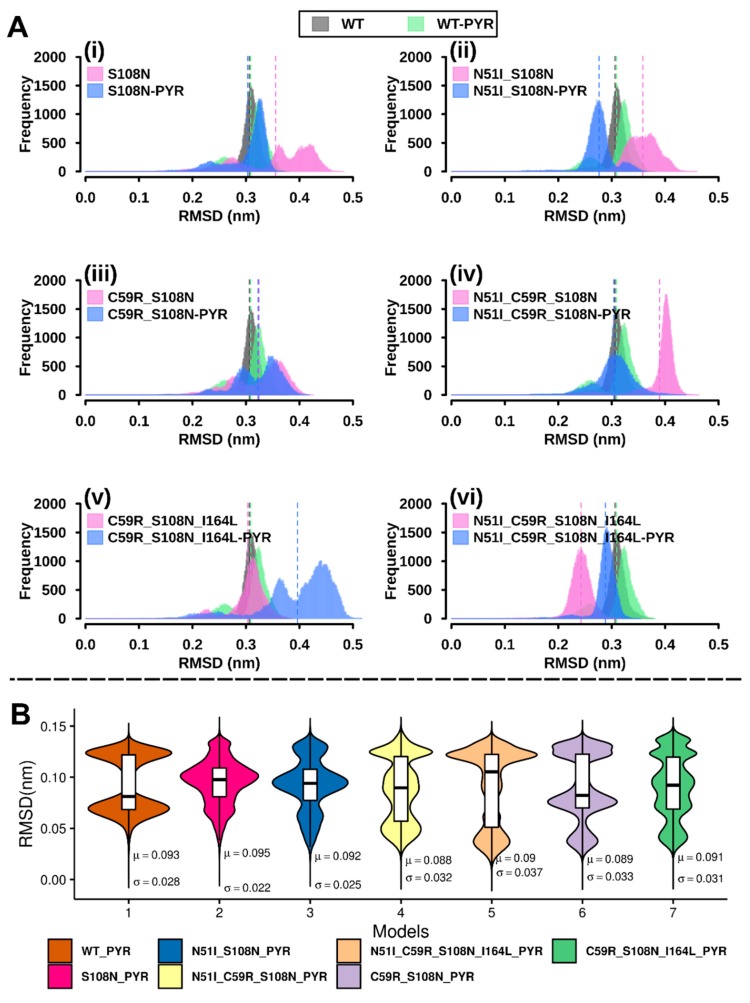
(A) Histograms showing protein root mean square deviation (RMSD) frequency distribution during 100-ns simulations: RMSD values were computed based on back-bone atom positions. The width corresponds to the number of conformations sampled by proteins over the molecular dynamics (MD) simulation. Y-axis (frequency) represents number of times a specific conformation was sampled during the MD simulation. (i) S108N, (ii) N51I_S108N, (iii) C59R_S108N, (iv) N51I_C59R_S108N, (v) C59R_S108N_I164L, and (vi) N51I_C59R_S108N_I164L. Color key: black WT—holo, green WT—pyrimethamine complex, magenta mutant—holo, and blue mutant—pyrimethamine complex. (B) Kernel density estimation graphs overlaid with boxplots showing the distribution of ligand RMSDs for each complex. Density traces were plotted symmetrically on each side: the width corresponds to the frequency of RMSD occurrence. Boxplots highlight the first, second (median), and third quartiles. The mean and standard deviation values are indicated by µ and σ, respectively.

