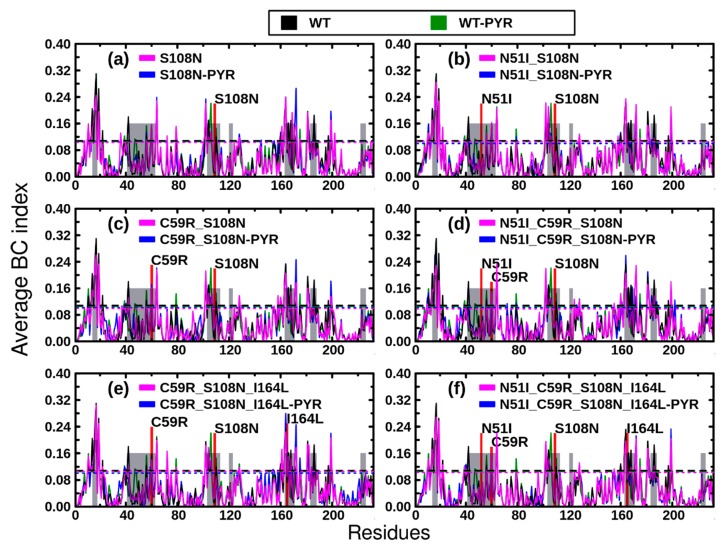
Figure 7.
Contact network analysis: Betweenness centrality (BC) results. Color key: black: WT holo, green: WT complexed with pyrimethamine, magenta: mutant holo, blue: mutant complexed with pyrimethamine. Lower threshold values are indicated by respective color-coded, doted lines. Grey shaded areas are regions of ligand interaction within the active site.

