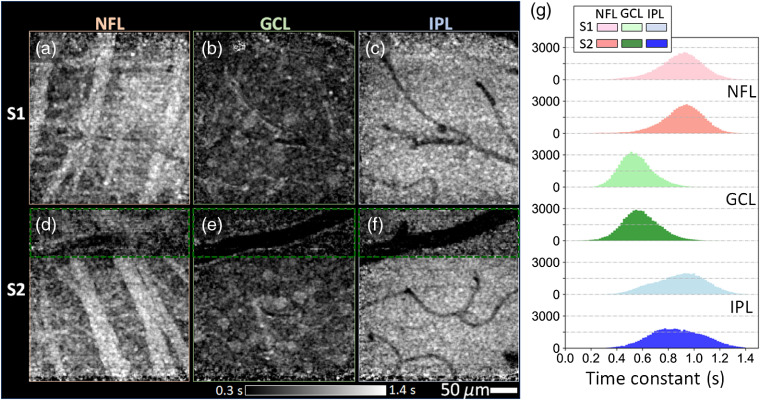
Fig. 2.
Time constants of inner retinal layers of subjects S1 (top row) and S2 (bottom row). Time constant images are shown as grayscale maps at depths of the (a) and (d) NFL, (b) and (e) GCL, and (c) and (f) IPL. Grayscale values ranged from 0.3 s (black) to 1.4 s (white). Color-coded histograms in (g) depict time constant distributions of the three layers. Note that time constants in (g) and main text exclude the region enclosed by the green dashed rectangular owing to unsatisfactory image registration caused by the large vessel.

