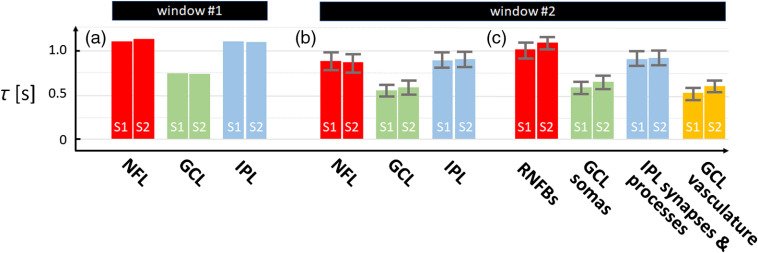
Fig. 3.
Time constants vary between retinal layer and tissue type. Time constants are shown for (a) and (b) three inner retinal layers and (c) specific tissue types within the layers using windows #1 and #2 and our AO-OCT volume data acquired with imaging protocol A. Error bars denote SD across the retinal layer or tissue type.

