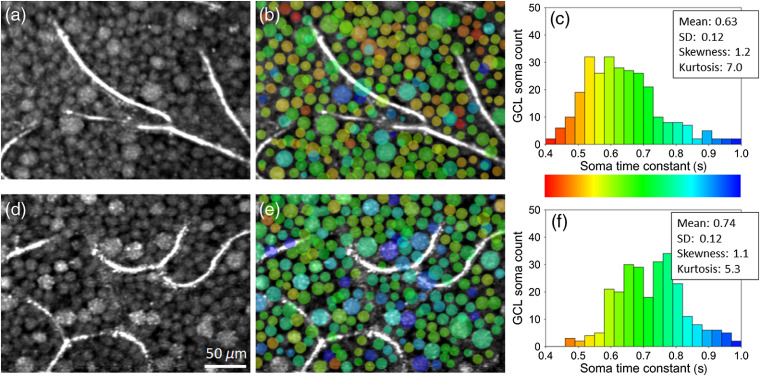
Fig. 4.
Time constants vary between GCL somas of both subjects: S1 (top) and S2 (bottom). (a) and (d) Registered and averaged reflectance amplitude images of the GCL reveal a contiguous mosaic of GCL somas disrupted only by capillaries. (b) and (e) Correlation time constants were computed for individual somas using window #3 and superimposed as semitransparent false colors as defined in (c) and (f) histograms. Note some time constant values in (b) and (e) are superimposed on capillaries and on each other as somas at these locations lie at a different depth than that of the images in (a) and (d), respectively.

