Fig. 5.
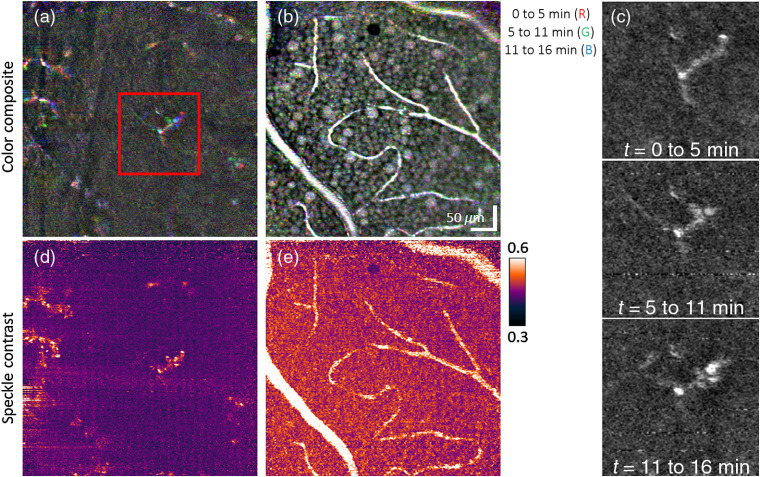
Testing for temporal dynamics of macrophage-like cells, GCL somas, and vessels over a time duration of minutes using (a)–(c) time-lapse imaging and (d) and (e) temporal speckle contrast of the same retinal patch of subject S1. Color-composite en face images of (a) macrophage-like cells at vitreal of the ILM and (b) GCL somas and vessels are constructed by assigning each RGB channel to an image acquired at a different time point. Thus, colored pixels in images indicate time-lapse changes. (c) Magnified view of a macrophage-like cell in the red box of (a) and color channels (i.e., time points) displayed separately. The sequence of time-lapse images is shown in Video 1 and further substantiates the movement of macrophage-like somas and processes. Cellular dynamics and blood flow in (a) and (b) are quantified on a more local spatial scale using the temporal speckle contrast metric as shown in (d) and (e), respectively (Video 1, MPEG, 0.8 MB [URL: https://doi.org/10.1117/1.NPh.7.1.015013.1]).

