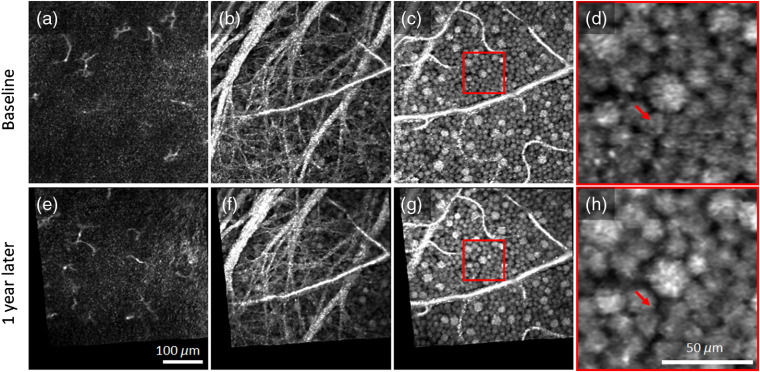
Fig. 8.
Pairs of AO-OCT images of the same patch of retina 1 year apart in subject S2 (top: baseline, bottom: 1 year later). En face images were extracted (a) and (e) vitreal of the ILM where macrophage-like cells were found to reside, (b) and (f) within NFL to visualize the intricate web of RNFBs, and (c) and (g) within GCL to visualize GCL somas and vasculature. (d) and (h) Magnified view of GCL neurons in the red box of (c) and (g), respectively. The arrow in the top magnified image points to a soma that is missing 1 year later. Arrow in the bottom magnified image points to the same retinal coordinates and reveals that the surrounding somas migrated into the void left by the missing soma. No other somas were found missing. Video 4 highlights differences accrued over the 1-year interval by alternating between the two en face AO-OCT images (Video 4, MPEG, 2.2 MB [URL: https://doi.org/10.1117/1.NPh.7.1.015013.4]).

