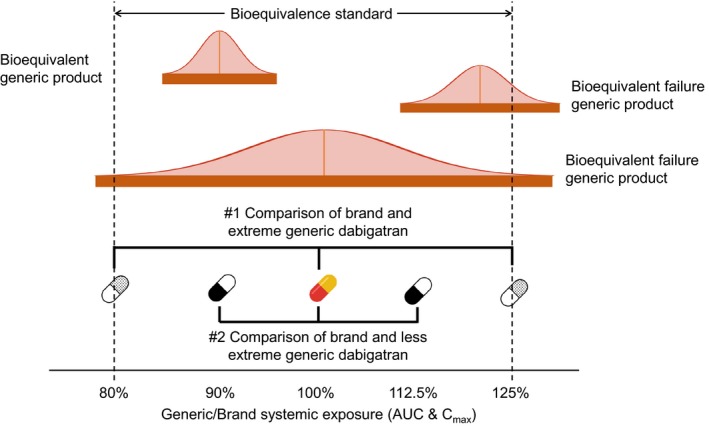
Figure 1.

Demonstration of potential bioequivalent results and two comparisons made in this study. The solid orange bars represent the 90% confidence intervals of the bioequivalence study AUC and Cmax generic/brand ratios normally distributed around the geometric mean generic/brand ratio. Falling beyond 80–125% thresholds is a “failure” of bioequivalence. Comparison #1 compares brand to generic dabigatran with extreme systemic exposure (125% and 80%). Comparison #2 compares brand to generic dabigatran with less extreme systemic exposure (112.5% and 90%). AUC, area under the plasma concentration‐time curve; Cmax, maximum observed concentration.
