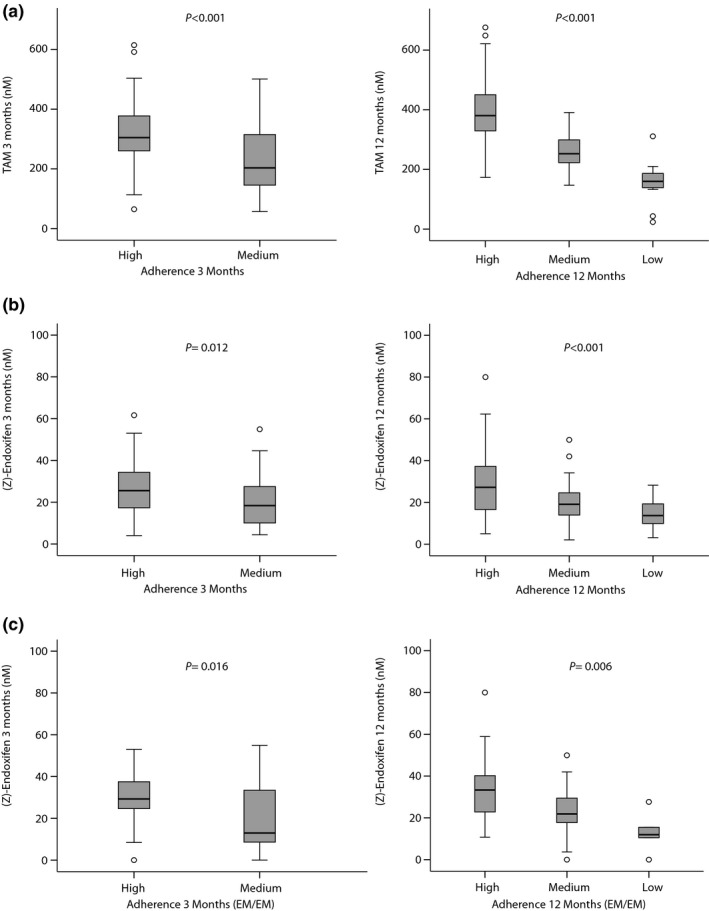
Figure 2.

Influence of treatment adherence on tamoxifen and (Z)‐endoxifen plasma concentration at 3 months (n = 156 patients) and 12 months (n = 139 patients). Plasma concentrations are presented as boxplots with boxes representing medians, 25% and 75% percentiles, and whiskers defined by the 5th and 95th percentiles and extreme values outside the whiskers. (a) TAM: Tamoxifen (parent drug). (b) (Z)‐endoxifen. (c) (Z)‐endoxifen for the subgroup of cytochrome P450 2D6 (CYP2D6). Extensive metabolizer (EM/EM) patients at 3 months (n = 67) and 12 months (n = 55). P values refer to test for different plasma concentrations between adherence categories. Data at 6 months not shown.
