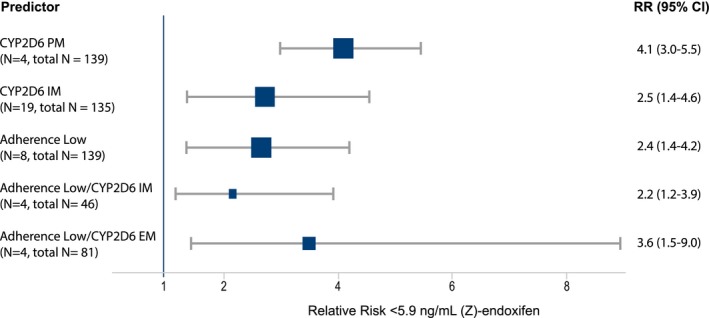
Figure 3.

Forest plot for the relative risk of not achieving the clinical threshold of a (Z)‐endoxifen concentration ≥ 5.9 ng/mL (15.8 nM) at 12 months. RR estimates are given as squared symbols with size weighted by the number of included patients. 95% CI, 95% confidence interval; EM, extensive metabolizer; IM, intermediate metabolizer; N, number of patients positive for predictor variable and in total analyses; PM, poor metabolizer; RR, relative risk.
