
Figure 3.
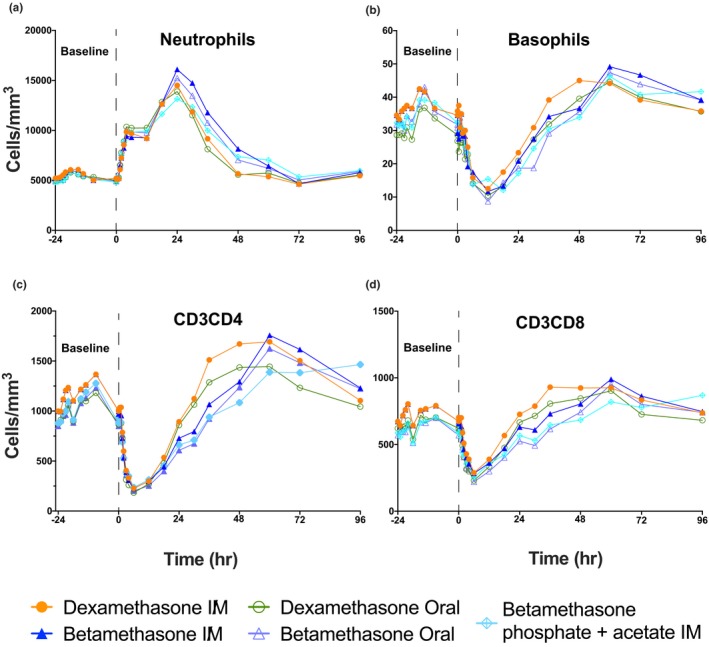
Pharmacodynamics of blood neutrophils, basophils, and CD3CD4 and CD3CD8 lymphocytes. Mean response curves giving the baseline measurements for the 24 hours before the 6 mg corticosteroid treatments given at hour 0. The treatments are color coded, with measurements to 96 hours. (a) Neutrophils, (b) Basophils, (c) CD3CD4 lymphocytes, and (d) CD3CD8 lymphocytes.