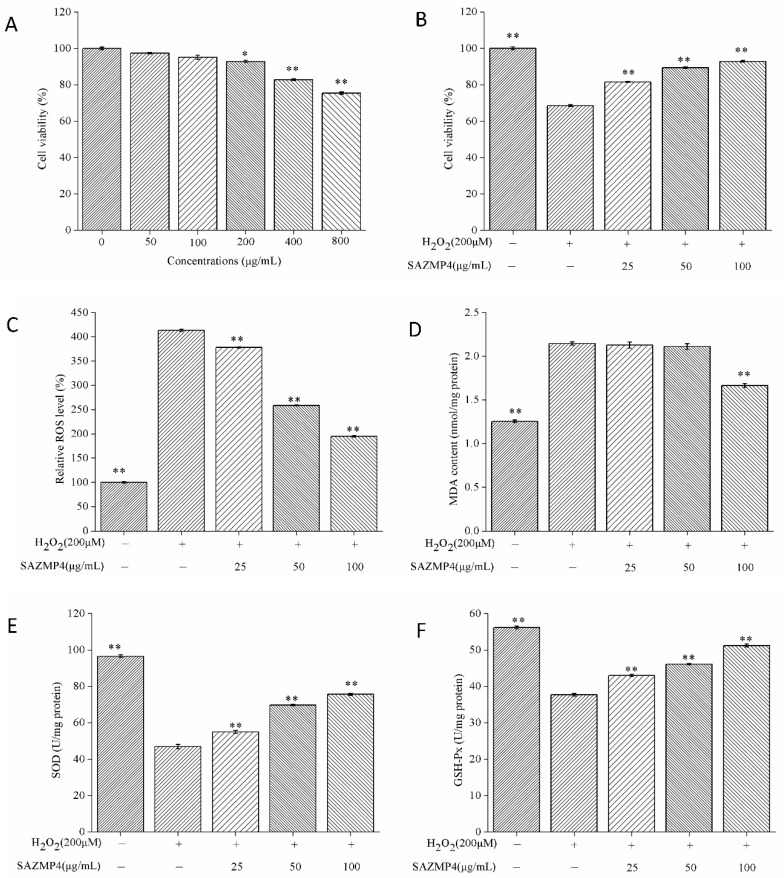
Figure 6.
Cell viability of Caco-2 with different concentrations of SAZMP4 (A). Cell viability of Caco-2 with 200 μM H2O2 and different concentrations of SAZMP4 (B). Intracellular level of ROS in Caco-2 cells (C). Intracellular level of MDA in Caco-2 cells (D). Activity of SOD in Caco-2 cells (E). Activity of GSH-Px in Caco-2 cells (F). The data are expressed as the mean ± SD (n = 5 wells per group). (*) p < 0.05 and (**) p < 0.01 versus the control group.

