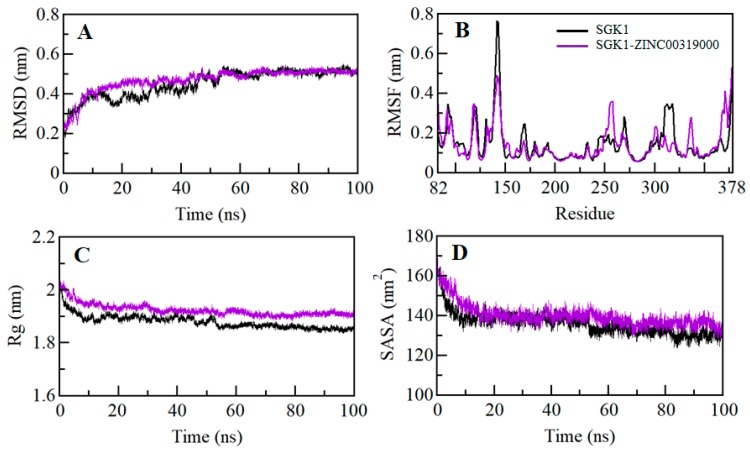
Figure 5.
Structural dynamics of SGK1 as a function of time. (A) Root-mean-square deviation (RMSD) plot of SGK1 before and after binding of ZINC00319000. (B) Residual fluctuations plot of SGK1 before and after ZINC00319000 binding. (C) Time evolution of the radius of gyration. (D) SASA plot of SGK1 as a function of time. The values were obtained from the 100 ns molecular dynamic (MD) simulation time scale. Black and violet represent values obtained for SGK1 apo and SGK1-ZINC00319000 complex, respectively.

