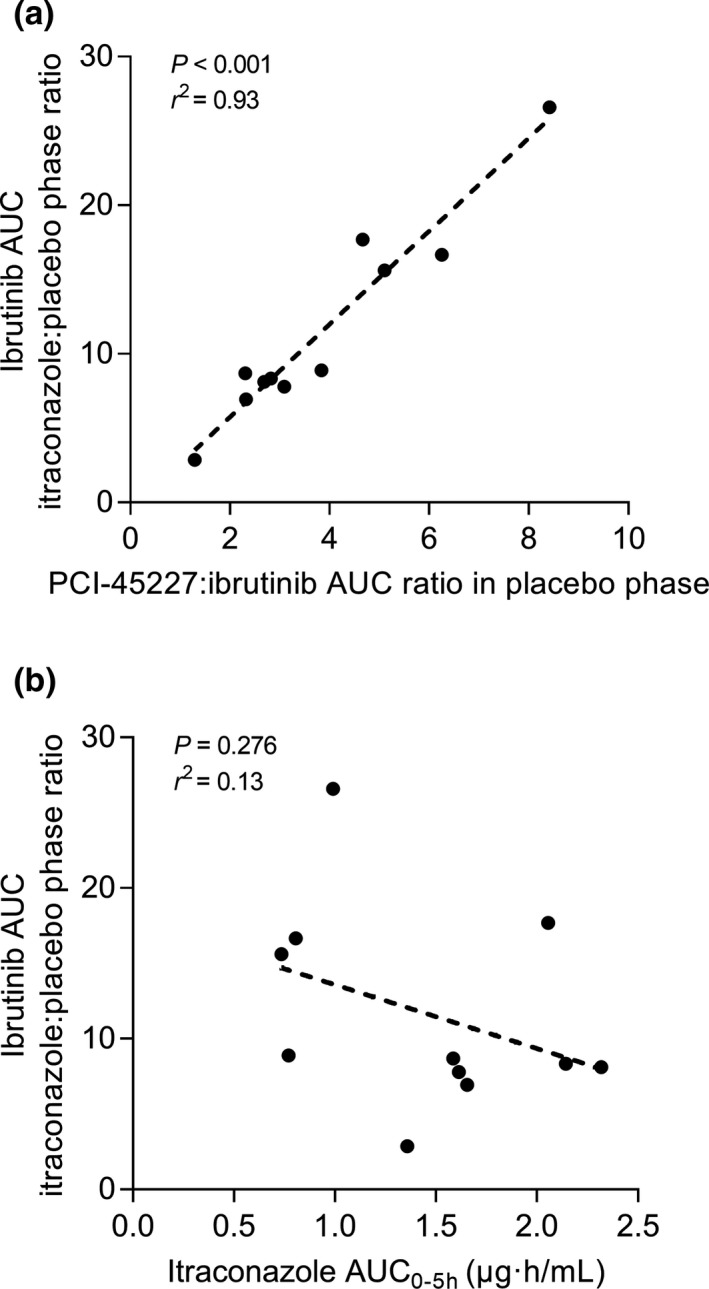
Figure 3.

The correlation of the PCI‐45227:ibrutinib area under the plasma concentration time curve from zero to infinity (AUC0–∞) ratio in the placebo phase with the ibrutinib AUC0–∞ itraconazole to control ratio (a), and the correlation of itraconazole AUC0–5 hours with the ibrutinib AUC0–∞ itraconazole to control ratio (b).
