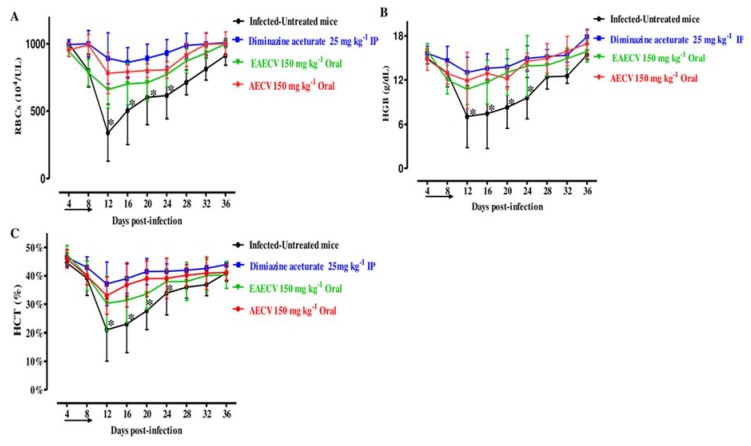
Figure 6.
RBCs, hemoglobin, and hematocrit changes in C. verum extract-treated mice. Graphs showing changes in the number of red blood cells (RBCs) (A), hemoglobin concentration (HGB) (B), and hematocrit percentage (HCT) (C) in mice treated with diminazene aceturate and two C. verum extracts. EAECA, ethyl acetate C. verum extract; AECA, acetonic C. verum extract. The arrow indicates 5 consecutive days of treatment. Asterisks indicate statistical significance (p < 0.05) based on one-way ANOVA Tukey’s test, available in the GraphPad Prism software. The data were the mean and standard deviation from two separate experiments (five mice per group).

