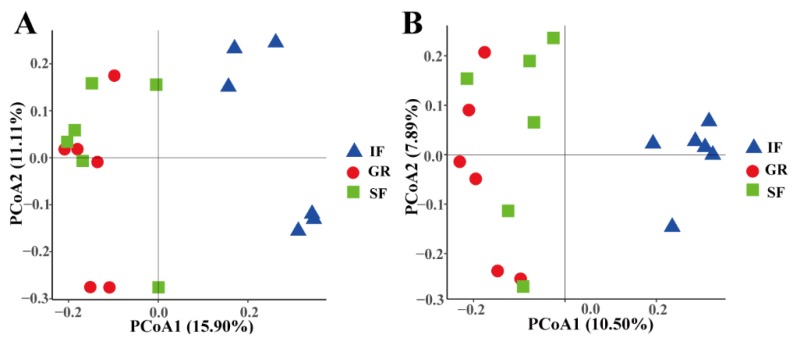
Figure 1.
Principal coordinate analysis (PCoA) plots of the bacterial and archaeal community compositions in the rumen fluid of the goat kids among the three feeding systems using an unweighted UniFrac metric. The percentages of variation explained by PC1 and PC2 are indicated on the axes. (A) The PCoA plot of the bacterial community composition; (B) the PCoA plot of the archaeal community composition.

