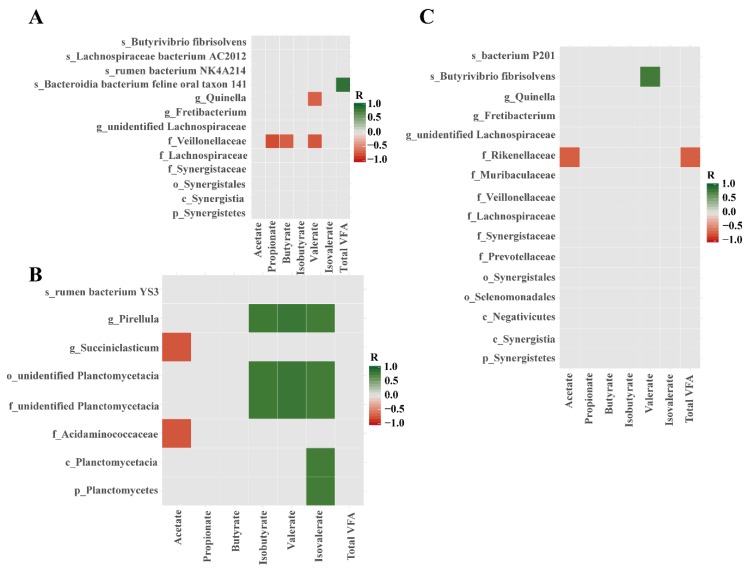
Figure 5.
Spearman correlations between bacterial biomarkers and VFAs in the GR (A), IF (B), and SF (C) groups. Correlations with a threshold of statistical significance at p < 0.05 were visualized. The green color represents a positive correlation and the red color represents a negative correlation.

