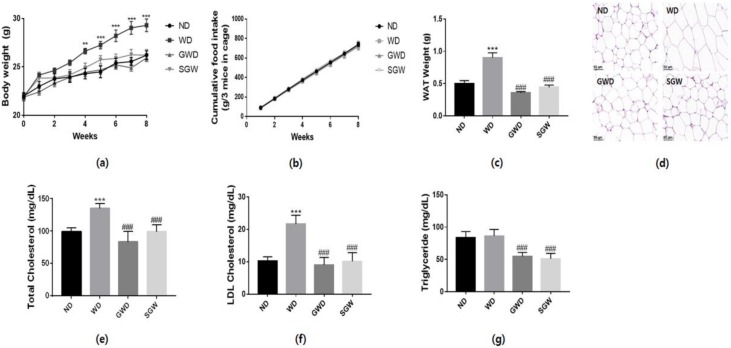
Figure 1.
Changes of body and white adipose tissue (WAT) weight and lipid metabolism. (a) Body weight changes during the 8 weeks of feeding; (b) Cumulative food intake during the 8 weeks of feeding; (c) WAT weight; (d) Hematoxylin and eosin (H&E) staining of WAT; (e) Total cholesterol levels; (f) Low-density lipoprotein cholesterol levels; (g) Triglyceride levels. Data are presented as the mean ± SEM for nine mice per each group (** p < 0.01, *** p < 0.001 vs. ND; ### p < 0.01 vs. WD).

